In the dynamic and ever-evolving world of cryptocurrency trading, where prices can skyrocket or plummet within minutes, having a robust toolkit is essential for success. Among the many tools at a trader’s disposal, Chart Patterns stand out as powerful indicators that can provide valuable insights into market dynamics and help analyze the market.
Chart patterns serve as visual representations of market data, condensing volumes of information into easily interpretable patterns. These patterns are formed by market participants’ collective actions and sentiments, encapsulating their buying as well as selling pressures.
Moreover, chart patterns serve as a common language among traders, facilitating communication and enhancing collaboration within the trading community. By sharing knowledge and insights about chart patterns, traders can learn from one another’s experiences, refine their strategies, and collectively contribute to a deeper understanding of the market.
In this blog, we will delve into five essential chart patterns that every crypto trader should have in their arsenal. These patterns have proven their significant time and again, aiding traders in making well-informed decisions in the face of market volatility. By familiarizing yourself with these patterns, you will be better equipped to navigate the exciting and often unpredictable world of cryptocurrency trading.
Why Do We Use Chart Patterns?
Chart patterns serve as invaluable tools for traders in various financial markets, including the cryptocurrency market. These patterns are derived from historical price data and provide visual representations of market behavior over time.
By studying chart patterns, traders can gain insights into market psychology, identify recurring patterns, and make informed trading decisions. Here are several reasons why chart patterns are widely used in trading:
- Identifying Trends: Chart patterns help traders identify the prevailing trend in the market. By recognizing patterns such as higher highs and higher lows (an uptrend) or lower highs and lower lows (a downtrend), traders can align their strategies with the market direction.
- Predicting Price Movements: Chart patterns offer insights into potential future price movements. By analyzing historical patterns, traders can anticipate trend continuations, trend reversals, and breakout opportunities.
- Determining Support and Resistance Levels: Chart patterns help traders identify key support and resistance levels in the market. These levels provide valuable information for setting profit targets and stop-loss orders.
- Gauging Market Sentiment: Chart patterns reflect the ongoing battle between buyers and sellers in the market. They provide insights into market sentiment and the balance of power between bulls and bears.
- Risk Management: Chart patterns assist traders in implementing effective risk management strategies. By identifying support and resistance levels, traders can place stop-loss orders to limit potential losses and protect their capital.
In short, chart patterns are invaluable tools for traders in the cryptocurrency market. They provide insights into trends, price movements, support and resistance levels, breakout opportunities, market sentiment, along with risk management. However, by mastering chart pattern analysis, traders can enhance their decision-making process, increase their probability of success, and navigate the dynamic and often volatile cryptocurrency market more effectively.
Types of Chart Patterns
Chart patterns are essential tools for crypto traders as they provide valuable insights into market behavior and help identify potential trading opportunities. Meanwhile, there are primarily three types of chart patterns: continuation patterns, reversal patterns, and bilateral patterns.
A continuation indicates that a current trend will continue. In contrast, reversal chart patterns imply that a trend is about to shift. And the bilateral chart patterns alert traders to the fact that the price could go in either direction, indicating that the market is highly volatile. Apart from that, let’s dive deeper into the five essential chart patterns every crypto trader should have in their arsenal:
Head And Shoulder
The head and shoulders pattern is a popular and reliable reversal pattern that signals a potential trend change. It consists of three peaks, with the middle peak (the head) being the highest and the two outer peaks (the shoulders) of similar height.
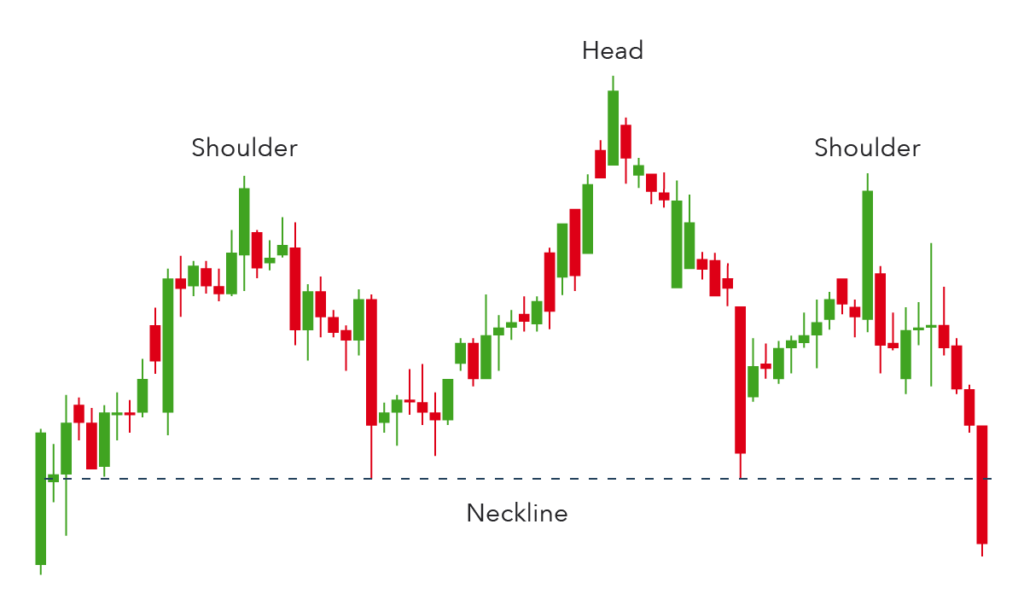
The neckline, drawn by connecting the lows between the peaks, acts as a support level. A break below the neckline indicates a bearish trend reversal, while a break above it suggests a bullish reversal. This pattern is widely observed and is effective in identifying potential trend reversals.
Cup And Handle
The cup and handle pattern is a bullish continuation pattern that often appears during upward trends. It resembles a cup with a handle. The cup portion is a rounded bottom formation, indicating a temporary consolidation or correction. The handle represents a smaller consolidation period near the highs of the cup.
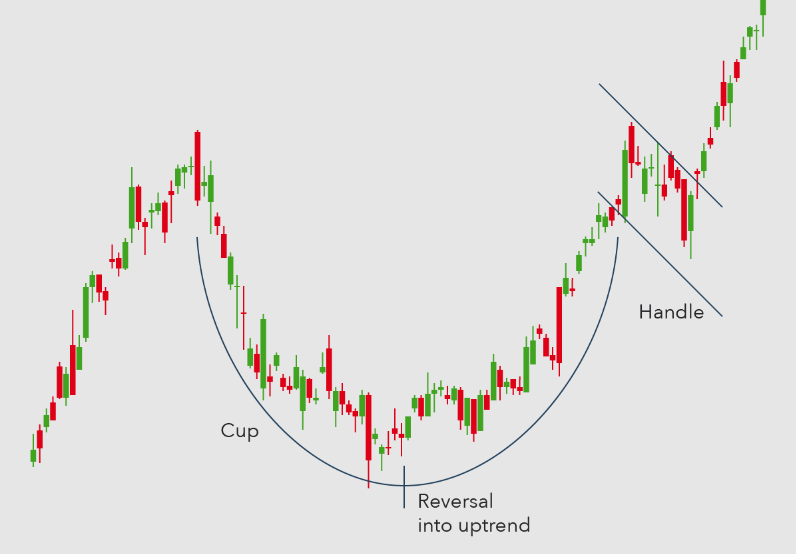
A breakout above the handle’s resistance level signals a potential upward trend continuation. Traders often use this pattern to identify buying opportunities after a brief consolidation period.
Wedges
These are chart patterns formed when two trendlines converge, creating a narrowing price range. They can be either ascending (bullish) or descending (bearish). Ascending wedges show a weakening of the previous downward trend, as the price makes higher highs and higher lows within the pattern.
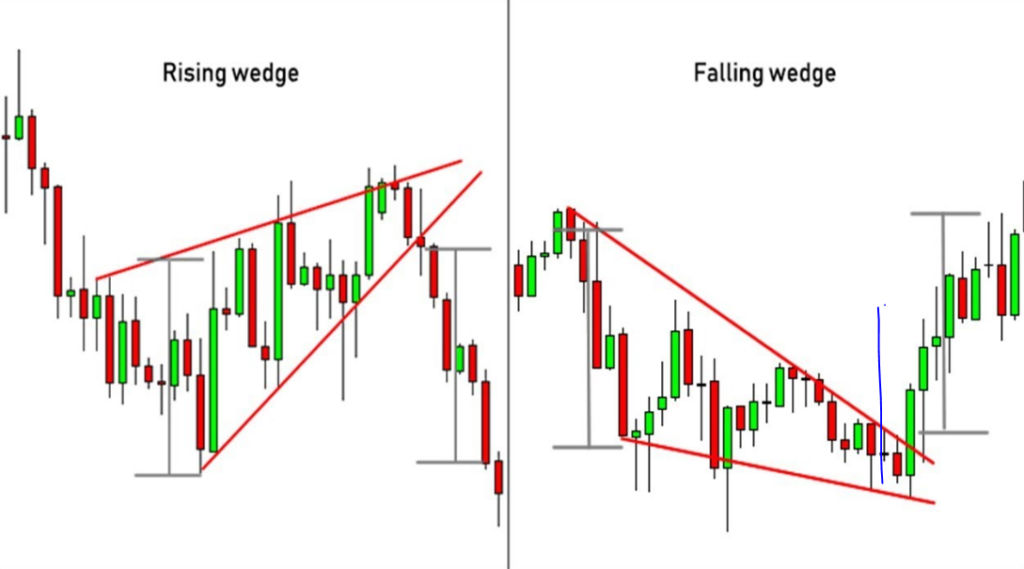
On the other hand, descending wedges suggest a weakening of the previous upward trend, with lower highs and lower lows. Wedges provide valuable insights into potential trend reversals and breakouts. Traders closely monitor these patterns to identify opportunities for entering or exiting trades.
Rounding Bottom
The rounding bottom pattern, also known as a saucer pattern, signifies a potential trend reversal from a downtrend to an uptrend. It resembles a U-shaped curve and indicates a gradual shift in market sentiment.
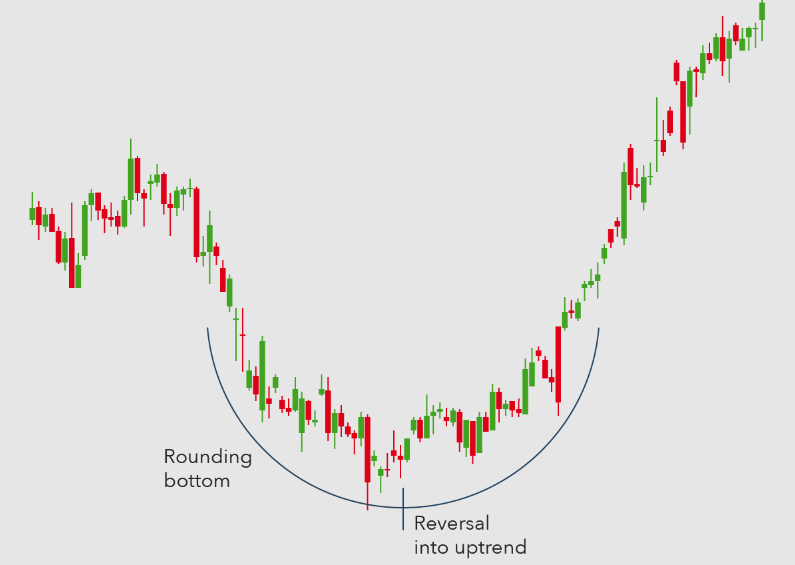
The pattern forms when the price gradually reaches a low point, followed by a gradual rise. Traders look for a break above the pattern’s resistance level as confirmation of a bullish trend reversal. The rounding bottom pattern is particularly useful for long-term investors who seek to identify the end of a downtrend and position themselves for a potential upward move.
Triangle Patterns
Triangles are consolidation patterns that indicate a period of indecision between buyers and sellers. There are three main types of triangles: ascending, descending, and symmetrical.
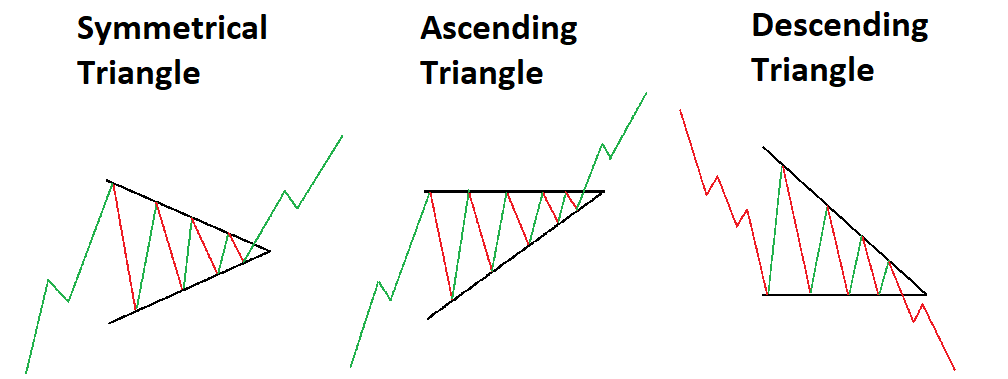
Ascending triangles have a flat top and a rising bottom, suggesting a bullish breakout. Traders observe this pattern to identify potential buying opportunities. Descending triangles have a flat bottom and a descending top, indicating a bearish breakout. Traders monitor this pattern to identify potential selling opportunities. Symmetrical triangles have converging trendlines, suggesting a potential breakout in either direction. These patterns provide valuable insights into potential breakouts and can be used to measure price targets.
Conclusion
Chart patterns are invaluable tools for crypto traders, providing insights into market trends, potential reversals, and breakout opportunities. Also by familiarizing themselves with essential chart patterns like the head and shoulders, cup and handle, wedges, rounding bottom, and triangles, traders can enhance their technical analysis skills and make more informed trading decisions.
It is essential to combine chart patterns with other technical indicators and risk management strategies for a well-rounded trading approach. Therefore, understanding these chart patterns will help crypto traders navigate the volatile cryptocurrency markets and increase their chances of success.
To know more about crypto trading Chart Patterns, go check out SunCrypto Academy.
Disclaimer: Crypto products and NFTs are unregulated and can be highly risky. There may be no regulatory recourse for any loss from such transactions. All content provided is for informational purposes only, and shall not be relied upon as financial/investment advice. Opinions shared, if any, are only shared for information and education purposes. Although the best efforts have been made to ensure all information is accurate and up to date, occasionally unintended errors or misprints may occur. We recommend you to please do your own research or consult an expert before making any investment decision. You may write to us at [email protected].